Fundraising Module (Discovery)
Fundraising discovery sessions: Summary & analysis
Participant overview
In March 2025, we conducted online interviews with Australian independent schools and UK government-funded schools (recruited by our Customer Success consultants) to gain insights into their experiences with managing fundraising events. Our focus was to gather insights about the maturity of their fundraising events and find out about the tools and processes they use to engage and manage their donor communities and events.
In total 7 online interviews were conducted. 4 Australian schools and 3 UK schools.
Fundraising maturity
High
- Runs multi year campaigns and regular fundraising events with targets amounting to millions of dollar/pounds.
- Staff & students teams run these events and dedicated/outsourced 3rd party teams are hired for certain fundraising events.
- Paid platforms/systems are used to keep track of event payments, donor activity, engagement & history.
Medium
- Runs regular events with smaller targets.
- Events are usually managed by a few staff members.
- Donor details, record of cashflows, events are managed manually.
- Events payments & ticketing are done via free platforms.
Low
- Events are mostly ad-hoc and with no target amount.
- Donor records & cash flows are not monitored.
- Usually the money raised goes to charity or donated for a cause.
- Events payments & ticketing are done via free platforms.
- Smaller events with cash donations are run by students and monitored by staff.
Event types
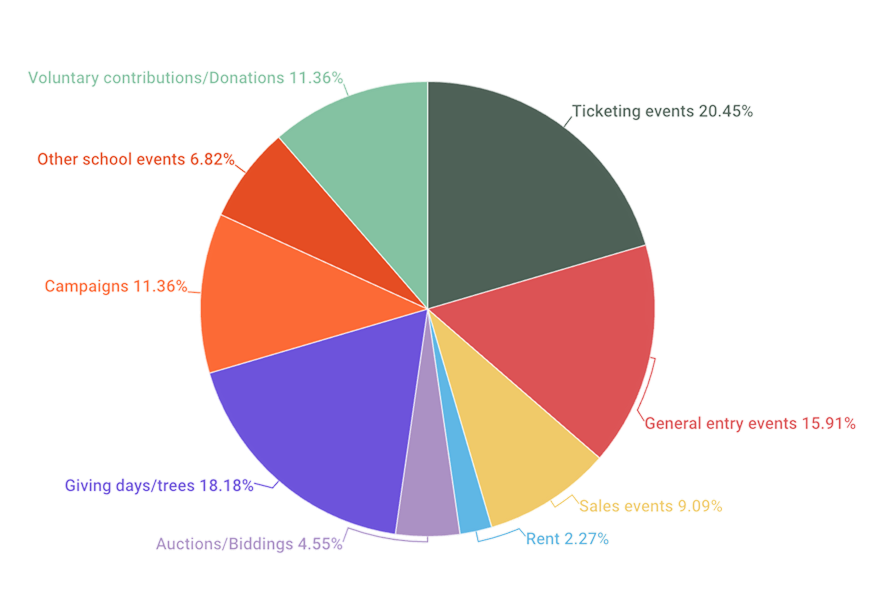
These are the event types that schools use for fundraising. They may be done annually, monthly or even weekly events (like non-uniform days).
Payment methods

Insights
- Online payments are not only how majority of event payments are made, it’s the most preferred method.
- Major events use online payments. (Giving days, Campaigns, Plays, Auctions)
- Smaller events like non-uniform days, bake sales, canteen use cash payments. Generally, in low & mid tier fundraising schools, students manage these cash events.
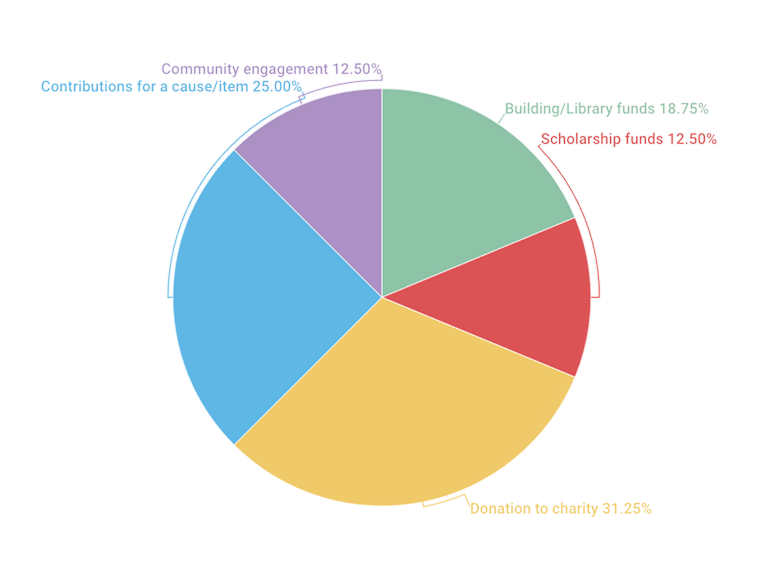
Cause for fundraising
Insights
- Though there’s only a few fundraising events for ‘Building/Library funds’, this is where a lot of money comes into schools. These events are also the major ones the schools conduct.
- Money from smaller events are typically used for contributions towards a cause/item. Ex: Bake sales for a student struggling to pay the term’s fees.
- Building funds, Library funds & donations to charity are tax deductible. (Mostly any funds or donations with invoices are tax-deductible)
- Smaller event like bake sales, non-uniform days that generate smaller amounts without invoices and mostly with cash are not tax-deductible. Ex. Contributions for a cause/item
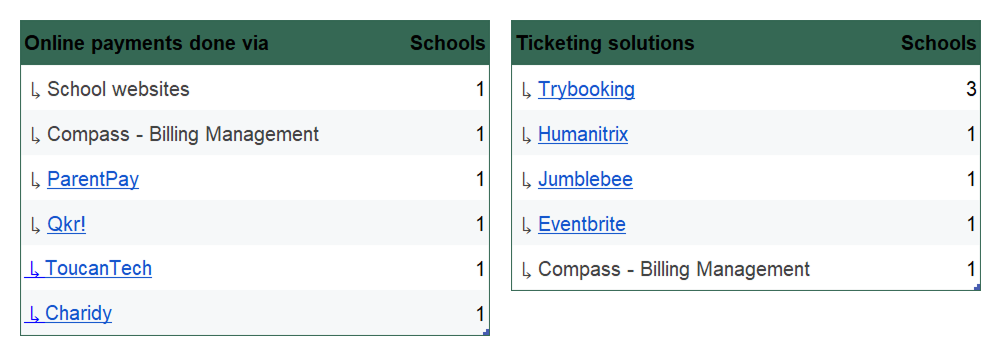
Payment & ticketing
Insights
- Schools with the high fundraising maturity tend to use platforms that provide advanced analytics and user engagement tracking features.
- Along with tickets, most of the ‘Ticketing platforms’ provide event management functionalities like check-ins, payments via mobile app, seating, invoicing, etc.
- These apps are free to use. They skim off a percent of every payment made through their platform.
Features list
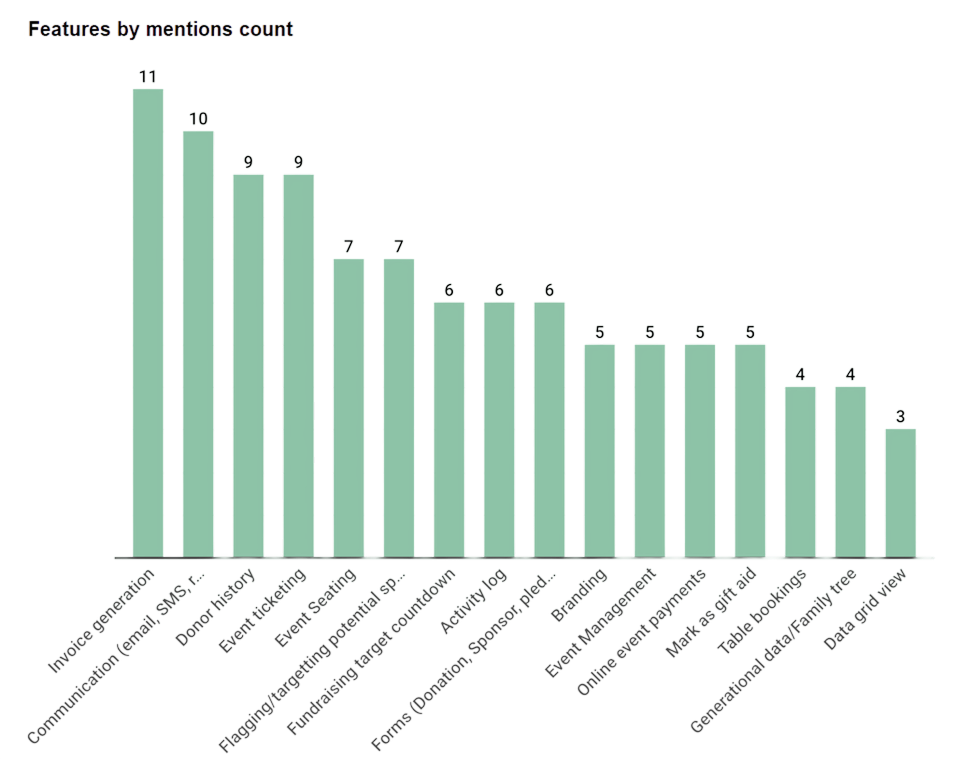
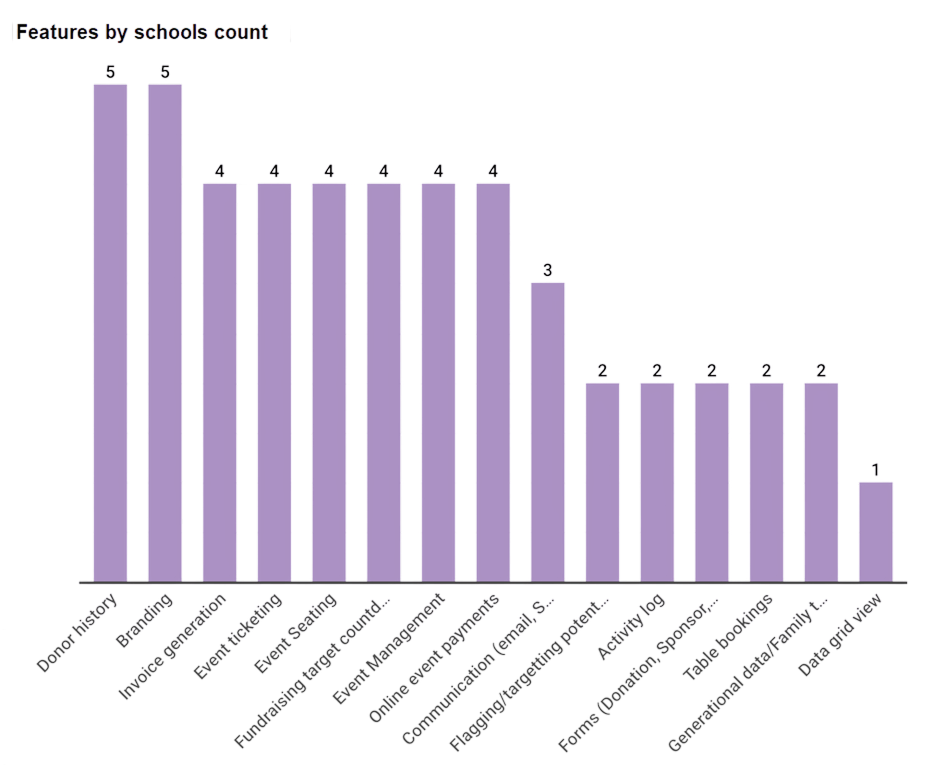
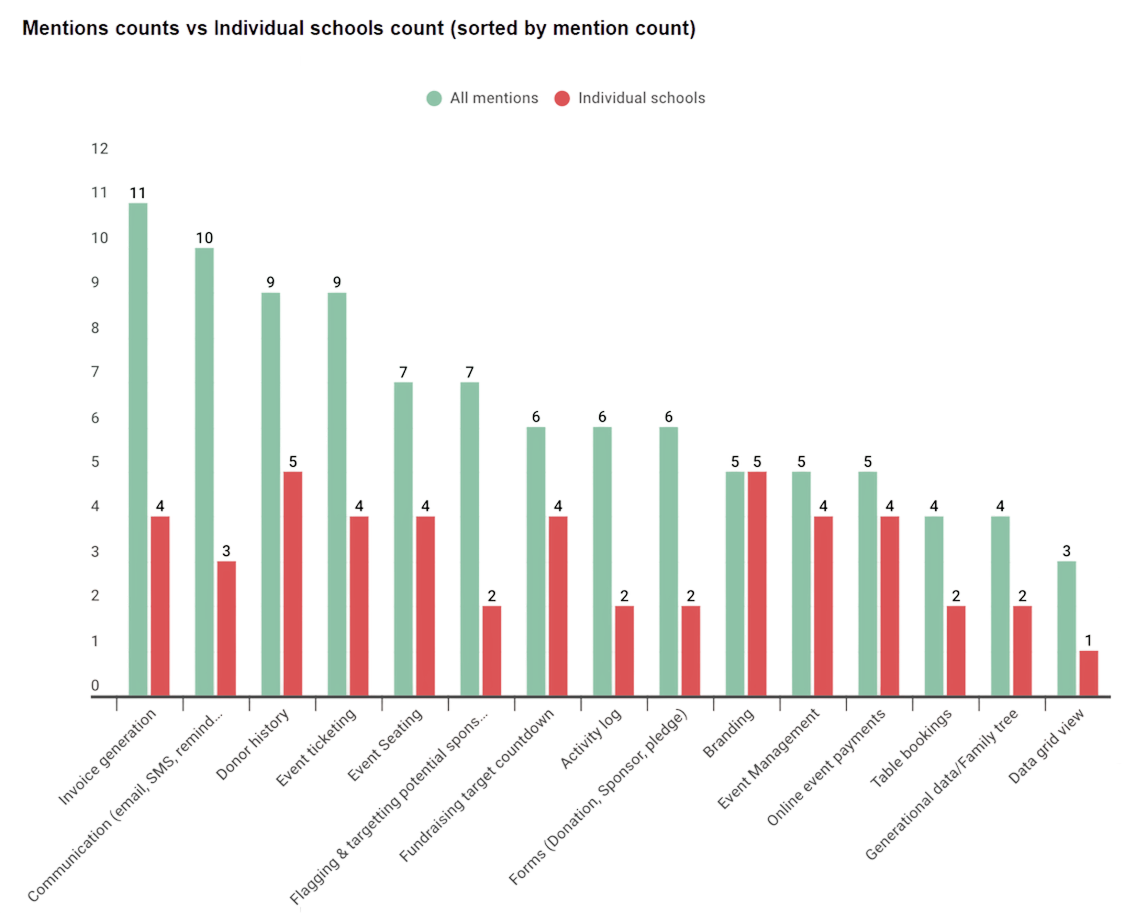
Top 5 features (by individual schools count)
Donor history
Top featureViewing previous donations from users allows admin/staff to view and target specific people/groups depending on the event & donation, fundraising cause etc.
Branding
Top featureRepresentation of the school in fundraising events is important for building community engagement along with building trust.
Invoice generation
Top feature31.25% of all fundraising event causes are to donate to charity & 18.75% goes toward Building/Library funds. This implies that invoice & receipt generation is required to make tax claims. We also want the ability to mark donations as ‘Gift aid’. Currently the staff/admin has to manually update that invoices as gift aid.
Event ticketing
20.45% of fundraising events are ticketed. Schools currently use 3rd party platforms for ticketing.
Event seating
Seating plans for events such as Plays, trivia night etc. along with ticketing.
Communications
High mention countsSchools want the ability to communicate about events to target audiences (parents, alumni etc.). Communication includes (but not limited to) sending event invites, event reminders, event targets and event success. Donors like to know about how their donations have been useful for a cause. This enables school to build community engagement that in turn would drive higher donations.
Pain points
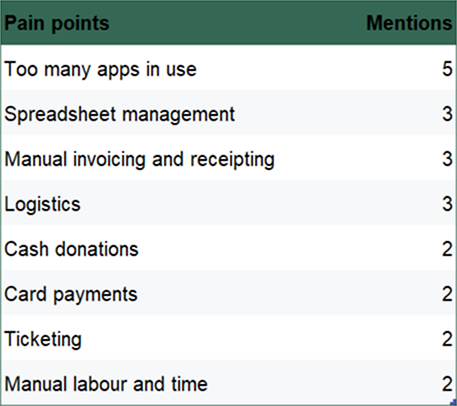
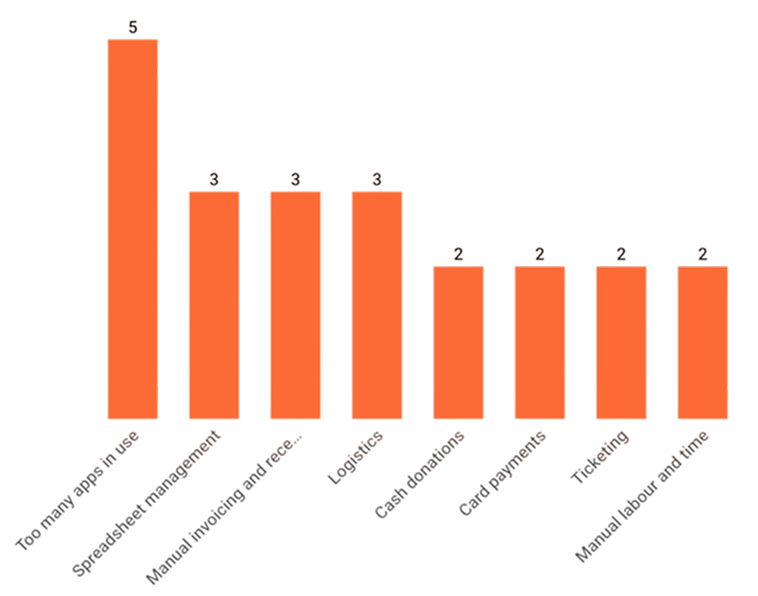
Too many apps in use
Top pain pointSchools use different apps to communicate about events, sign up donors, set up events, manage ticketing, manage seating, manage online payments. This means multiple staff has to be assigned to events for each process.
Spreadsheet management
Top pain pointDonor/sponsor information are recorded in spreadsheets. This makes it difficult to target specific donor groups (eg. year 1980 graduates) and within the donor tiers (tier 1 donor, tier 2 donors according to their donation value).
Manual invoicing & receipting
Top pain pointSince schools can’t make an invoice as gift aid, staff has to manually take care of this process. There will be hundreds of invoices that need to be taken care of and it’s probably just one staff doing this work.
Logistics
Setting up events and following through till the end proves to be difficult. Especially with too many apps in place.
Cash donations
Cash donations are always difficult to maintain cause at the end of the day, they have to be manually counted and accounted for. Schools prefer card or online payments instead.
Card payments
Card payments are preferred to cash payments. This is a hassle as schools have to set up terminals around the campus during events.